
Microbial diversity declines in warmed tropical soil and respiration rise exceed predictions as communities adapt
- Perturbation of soil microbial communities by rising temperatures could have important consequences for biodiversity and future climate.
- Particularly in tropical forests where high biological diversity coincides with a vast store of soil carbon.
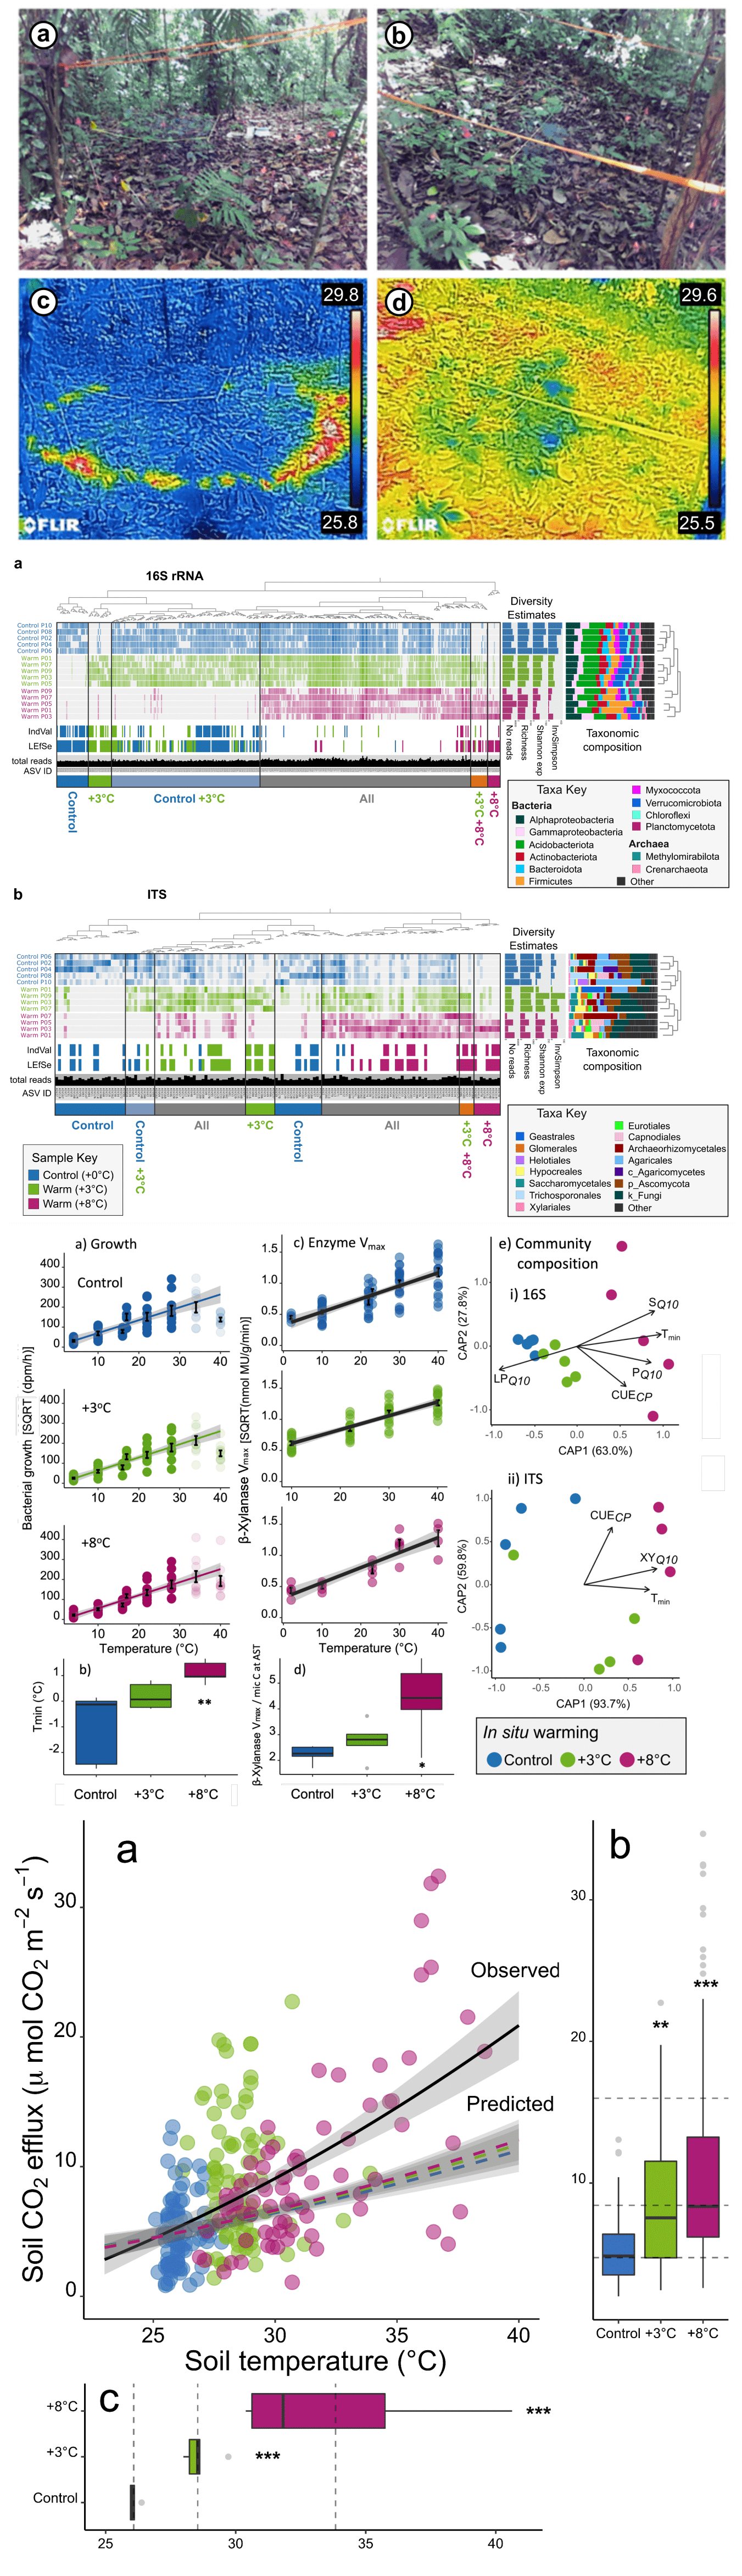
- We carried out a 2-year in situ soil warming experiment in a tropical forest in Panama.
- Found large changes in the soil microbial community and its growth sensitivity.
- Microbial diversity declined markedly with warming, demonstrating a breakdown in the positive temperature-diversity relationship observed elsewhere.
- Microbial community composition shifted with warming—many taxa were no longer detected while others enriched, including thermophilic taxa.
- Shifts resulted in community adaptation of growth to warmer temperatures, which we used to predict changes in soil CO2 emissions.
- The in situ CO2 emissions exceeded our model predictions threefold.
- Results suggest that warming of tropical forests will have rapid, detrimental consequences for soil microbial biodiversity and future climate.
Nature Microbiology 7 (2022) 🔗
Code for the highlight box above shamelessly stolen from the Meren Lab website.
Click here for article metrics on the Nature Microbiology website.
Site Overview
Welcome to the website of the Soil Warming Experiment in Lowland Tropical Rainforest project, or SWELTR for short. This site contains reproducible workflows and pipelines for all aspects of processing and analyzing the SWELTR high temperature experiment, entitled Microbial diversity declines in warmed tropical soil and respiration rise exceed predictions as communities adapt. Most (if not all) steps were performed in R. Though we ran some steps using the Smithsonian compute cluster (Hydra), all workflows can be run on a laptop. Workflows have a modular design, meaning they can each be run independently as long as you have the necessary input files described at the beginning of each workflow. Many of the tables have download or copy buttons that allow you to quickly export data in different formats. Citations, which are embedded in the workflows, can be copied for use in reference management software. Generally, all R code is available in each workflow. Code for displaying tables and other non-analytical features are always hidden but can be accessed from the qmd file on the site GitHub repo. At the bottom of each page there are a variety of Appendices including a bibliography, links to source code, instructions on accessing raw data, etc.
Data Availability
In order to run a complete pipeline, you either need the raw fastq files, available on the figshare project site, or the trimmed fastq files, available from the European Nucleotide Archive (ENA) under project accession number PRJEB45074 (ERP129199). See the specific pipeline or Data Availability page for more details.
Each workflow page within a pipeline also contains a Data Availability appendix that links to specific data packets require for the workflow. Or again, you can visit the Data Availability page for more information.
Pipelines & Workflows
There are 8 workflows in total. Each workflow contains code for processing the 16S rRNA and ITS data sets. These workflows are complete, reproducible, and designed to be run in order. That said, each ends with the creation of R data packages that can be used as input for the next workflow, allowing you to skip any individual section. In order, these are:
Processing Workflows
- DADA2. Workflow begins with raw fastq files and goes through the process of primer removal (using catadapt (Martin 2011)), filtering, quality screening, trimming, error correction, chimera removal, and taxonomic assignment using DADA2 (Callahan et al. 2016). The workflow ends with the generation of an Rdata file for the next step. Depending on the DADA2 version you have installed, you may get slightly different results due to fundamental changes in the code-base. This is unavoidable at times and the developers do the best they can to maintain fidelity across versions. We set random number seeds at the beginning of each workflow to ensure reproducibility. To see the package versions of tools used in each workflow, please see the R Session Information section on the bottom of each page.
- Data Set Prep. Workflow begins with the initial sequence and taxonomy tables from the DADA2 workflow and uses phyloseq (McMurdie and Holmes 2013) to define samples and sample groups, create phyloseq objects, and curate data sets. Summary data is provided throughout the workflow. Again, workflow ends with the generation of an Rdata file for the next step.
- Filtering. In Part A, we apply arbitrary filtering to the 16S rRNA and ITS data sets. In Part B we use PERFect (PERmutation Filtering test for microbiome data) (Smirnova, Huzurbazar, and Jafari 2019) to filter the data sets. And in Part C of this workflow, we use PIME (Prevalence Interval for Microbiome Evaluation) (Roesch et al. 2020) to filter the FULL 16S rRNA and ITS data sets.
Diversity Workflows
- Taxonomic. Taxonomic diversity primarily focused on taxon bar charts.
- Alpha Diversity. This section covers the distribution of reads across samples and includes histograms of read counts & rarefaction curves. Also covers estimates of alpha diversity using Hill numbers (Alberdi and Gilbert 2019) and includes normality tests, significance tests, & diversity plots.
- Beta Diversity Estimates of beta diversity including significance tests, beta dispersion, and ordination plots.
- DA ASVs & OTUs. Results and visualizations from Indicator Analysis and LEfSe.
- Metadata. Multivariate Analysis Overview of environmental metadata and community composition. Includes metadata Normality Tests, Normalization, Autocorrelation Tests, Dissimilarity Correlation Tests, Best Subset of Variables, Distance-based Redundancy, and Capscale analysis.
Though the workflows are annotated, they are not necessarily meant to be tutorials since we only provide minimal explanation. There are many great tutorials and explanations out there on amplicon processing that you can dive into.
Manuscript Visualization
Here is a word cloud of the manuscript, just for the fun of it ;) The size of each word in proportional to the number of times it appeared in the manuscript.
Acknowledgements
This study was supported by three fellowships to ATN—a UK NERC grant NE/T012226, a European Union Marie-Curie Fellowship FP7-2012-329360, and a STRI Tupper Fellowship. Further support came from a UK NERC grant NE/K01627X/1 to PM, an ANU Biology Innovation grant to PM and Simons Foundation grant No. 429440 to W. Wcislo, STRI, and support from the U.S. Department of Agriculture (USDA), Agricultural Research Service to KB. We thank Ben Turner for his contribution to SWELTR, especially during its initial phase of operation. For their support we further thank Oris Acevado, Dayana Agudo, Aleksandra Bielnicka, Gloria Broders, Melissa Cano, David Dominguez, Milton Garcia, Matthew Larsen, Julio Rodriguez, Hubert Szczygiel, Irene Torres, Esther Velasquez, William Wcislo, Klaus Winter and Joe Wright. For the purpose of open access, the author has applied a Creative Commons Attribution (CC BY) licence to any Author Accepted Manuscript version arising from this submission. Many of the computations were conducted on the Smithsonian High-Performance Cluster (SI/HPC), Smithsonian Institution (doi:10.25572/SIHPC).
Source Code
The source code for this page can be accessed on GitHub by clicking this link.
![]()
Data Availability
All data associated with this project can be accessed through the figshare Collection at doi:10.25573/data.c.5667571 with the exception of trimmed fastq files (primers removed), which are available through the ENA under project accession number PRJEB45074 (ERP129199).
Last updated on
[1] "2025-08-23 07:30:29 PDT"References
Alberdi, Antton, and M Thomas P Gilbert. 2019. “A Guide to the Application of Hill Numbers to DNA-Based Diversity Analyses.” Molecular Ecology Resources 19 (4): 804–17. https://doi.org/10.1111/1755‐0998.13014.
Callahan, Benjamin J, Paul J McMurdie, Michael J Rosen, Andrew W Han, Amy Jo A Johnson, and Susan P Holmes. 2016. “DADA2: High-Resolution Sample Inference from Illumina Amplicon Data.” Nature Methods 13 (7): 581. https://doi.org/10.1038/nmeth.3869.
Martin, Marcel. 2011. “Cutadapt Removes Adapter Sequences from High-Throughput Sequencing Reads.” EMBnet. Journal 17 (1): 10–12. https://doi.org/10.14806/ej.17.1.200.
McMurdie, Paul J, and Susan Holmes. 2013. “Phyloseq: An r Package for Reproducible Interactive Analysis and Graphics of Microbiome Census Data.” PLoS One 8 (4): e61217. https://doi.org/10.1371/journal.pone.0061217.
Roesch, Luiz Fernando W, Priscila T Dobbler, Victor S Pylro, Bryan Kolaczkowski, Jennifer C Drew, and Eric W Triplett. 2020. “PIME: A Package for Discovery of Novel Differences Among Microbial Communities.” Molecular Ecology Resources 20 (2): 415–28. https://doi.org/10.1111/1755-0998.13116.
Smirnova, Ekaterina, Snehalata Huzurbazar, and Farhad Jafari. 2019. “PERFect: PERmutation Filtering Test for Microbiome Data.” Biostatistics 20 (4): 615–31. https://doi.org/10.1093/biostatistics/kxy020.